Selected projects spanning machine learning for semiconductor manufacturing, CMOS device fabrication, and process-integration software.
Jump to: Wafer Defect Classification (ML) · 2 µm CMOS Fabrication · GabFab · Semiconductor Integration Simulator
Machine Learning Wafer Defect Signature Classification
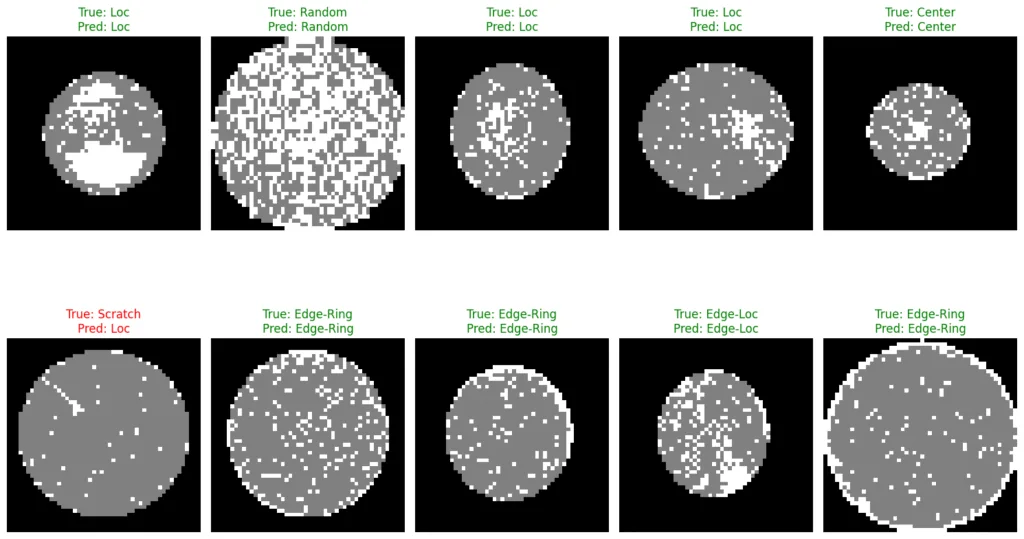
A supervised learning pipeline was developed using a Convolutional Neural Network (CNN) to classify wafer defect patterns from grayscale wafer maps. CNNs are well-suited for this task as they automatically extract spatial and hierarchical features, enabling robust defect recognition even under class imbalance. Figure 1 illustrates representative classification results for common defect signature patterns.
Model Architecture
- Input: 50×50 grayscale wafer maps
- Two convolutional layers (32 and 64 filters, 3×3 kernels) with ReLU activation and 2×2 max-pooling
- Dropout (0.5) for regularization
- Fully connected layer (128 units) → Softmax output for 8-class prediction
Training Setup
- Optimizer: Adam
- Loss: Categorical Cross-Entropy
- Batch size: 16
- Epochs: 10
- Validation split: 15%
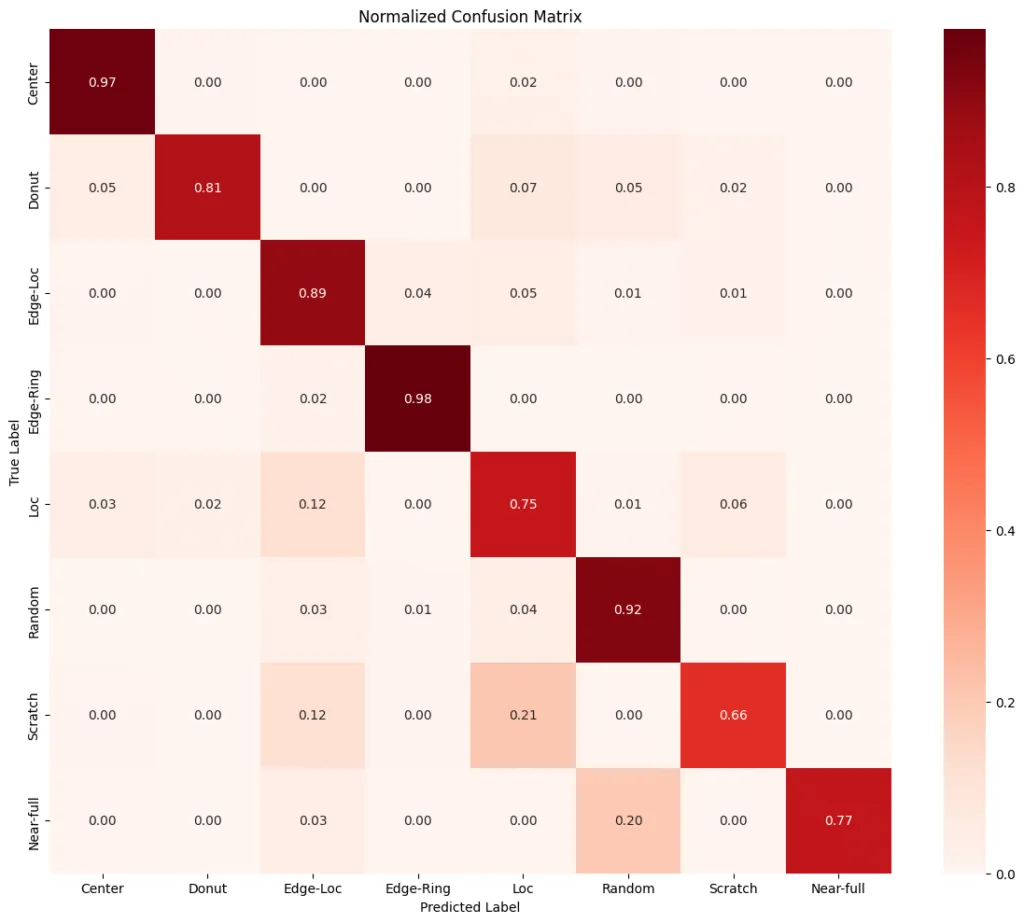
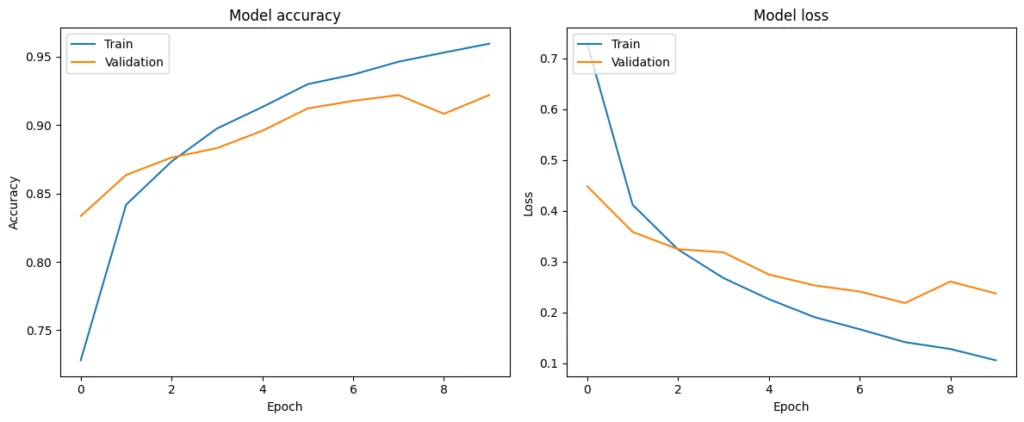
The trained CNN demonstrated strong classification accuracy across multiple defect classes, as shown in the confusion matrix (Figure 2), with clear convergence between training and validation performance (Figure 3).
2 µm CMOS Fabrication
This project integrated semiconductor fabrication, electrical characterization, and TCAD modeling to investigate and improve CMOS transistor performance at the 2 µm technology node.
Fabrication
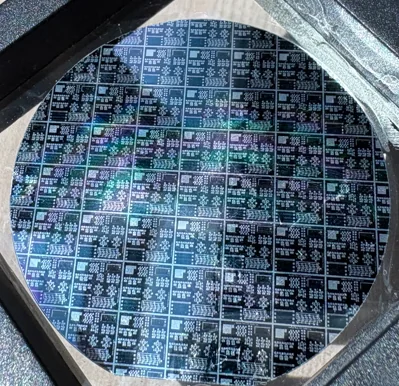
- Figure 4: 2-inch wafer with fabricated CMOS devices, including PMOS/NMOS transistors, capacitors, logic gates (AND, NAND, NOR, inverters), and ring oscillators.
- Process flow included oxidation, photolithography, dopant diffusion, and metallization.
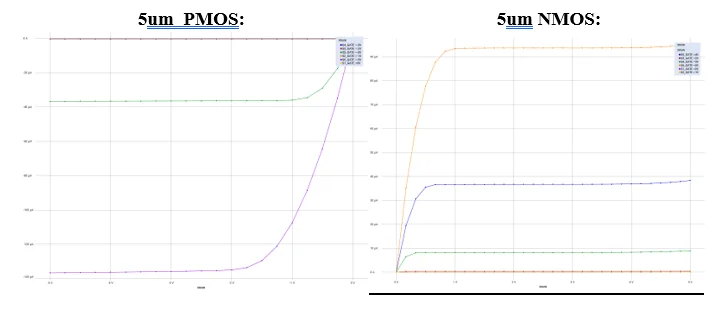
- Devices with channel lengths ≥5 µm functioned as expected, while 2 µm devices exhibited non-ideal, resistor-like IV behavior.
Characterization
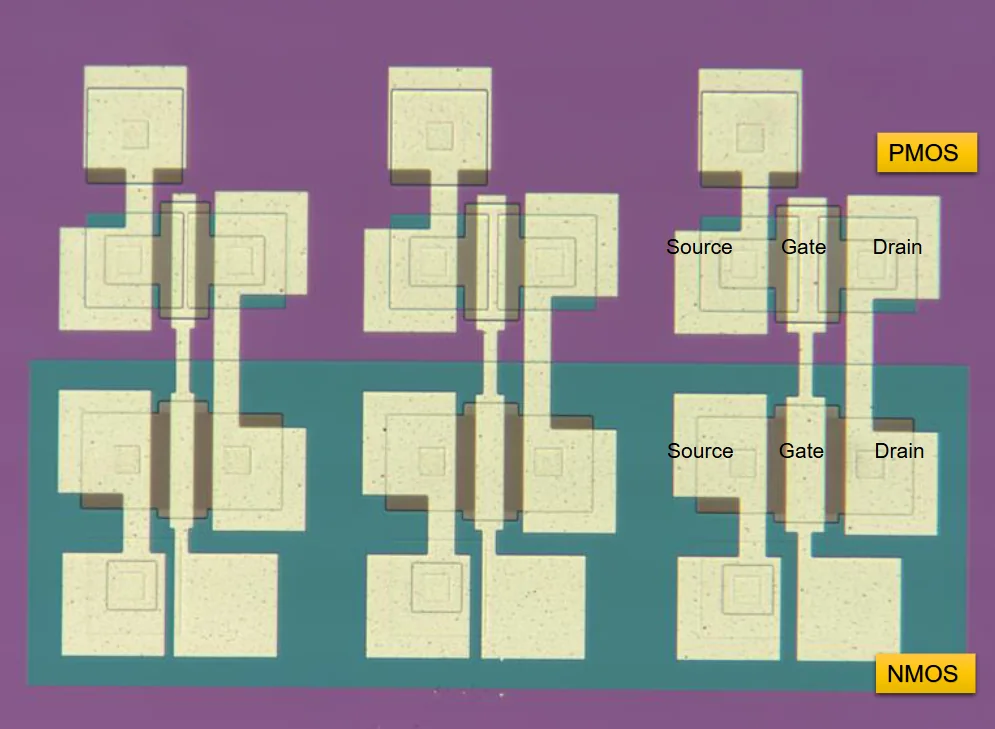
- Figure 5: Optical microscope image of fabricated 2 µm PMOS and NMOS layouts.
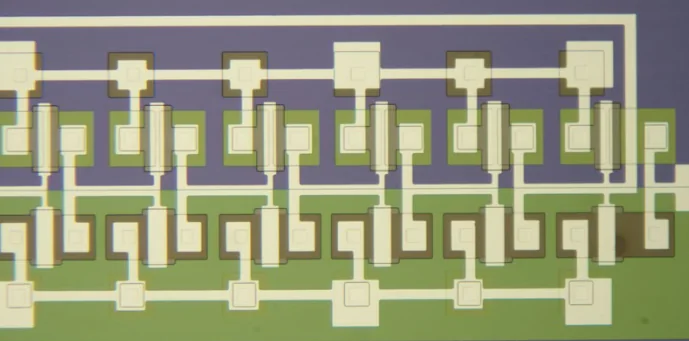
- Figure 6: Six cascaded CMOS inverters used to construct a ring oscillator.
- Figure 7: IV characteristics of fabricated devices. Larger (5–40 µm) transistors showed MOSFET-like operation, but 2 µm devices produced linear IV curves due to source/drain overlap.
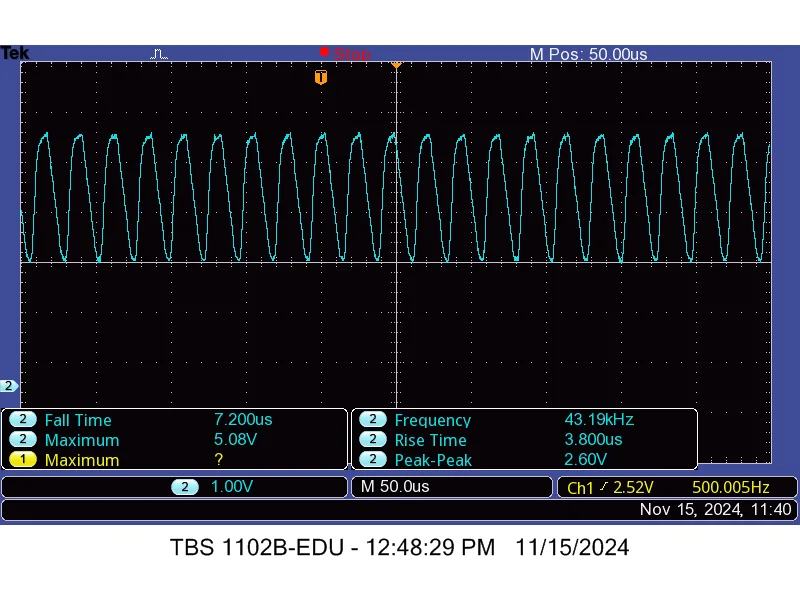
- Figure 10: Ring oscillator output demonstrating stable oscillation at 43.19 kHz, confirming circuit-level functionality.
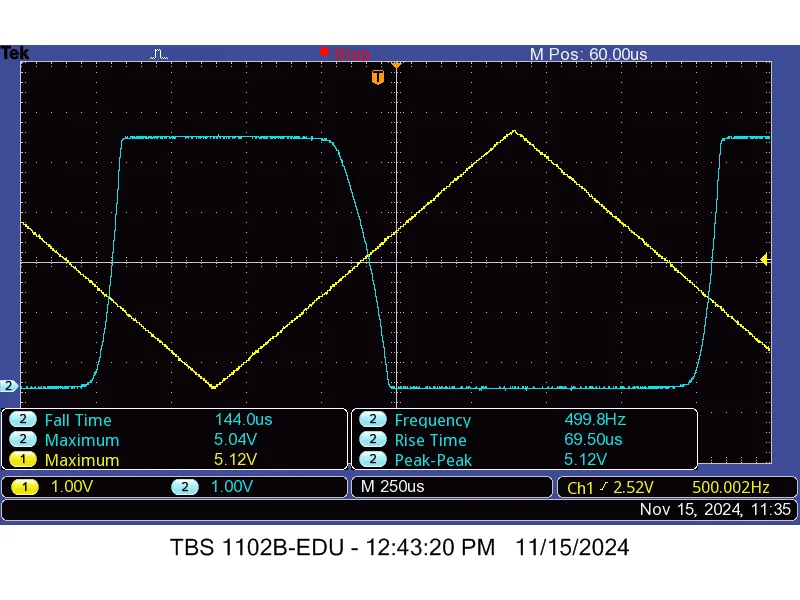
- Figure 11: Inverter transfer characteristics capturing switching threshold, propagation delay, and voltage swing.
Process Analysis
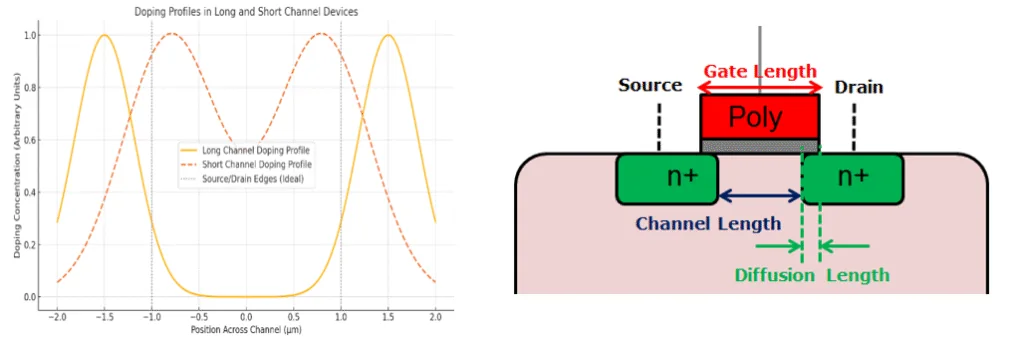
- Figure 8: Doping profiles and schematic showing that lateral junction diffusion (~1.3 µm per side) causes source/drain overlap in short-channel devices.
- SUPREM simulations confirmed a minimum channel length of 2.6 µm was required to avoid overlap, leaving the fabricated 2 µm devices unable to form a proper inversion channel.
- Root cause identified as uniform doping and oxide thickness across all devices, which was insufficient for short-channel scaling.
TCAD-Driven Improvements
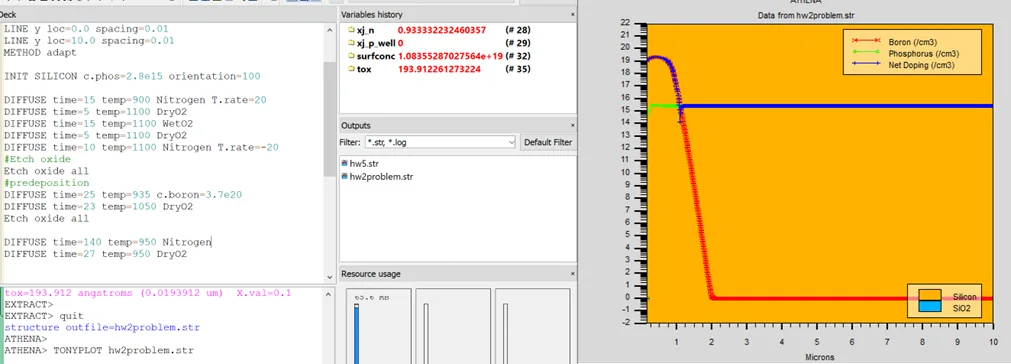
- Figure 9: SUPREM TCAD simulations of PMOS well doping profiles guided revised process conditions.
- Boron diffusion reduced 25 → 23 min and 1100 °C → 1050 °C.
- Oxidation and N+ drive-in shortened 40 → 27 min.
- Gate oxide thickness reduced from ~800 Å → 500 Å, improving electrostatic channel control.
- Junction depths decreased to 0.88 µm (N+) and 0.93 µm (P+), leaving ~0.2 µm effective channel length for inversion.
Outcome
- Modified process flow enabled functional 2 µm PMOS and NMOS transistors, resolving the shorting issue while preserving the behavior of larger devices.
- Ring oscillators and inverters confirmed restored CMOS logic operation across the wafer.
- The project demonstrated how integration of fabrication, characterization, and TCAD modeling provides a systematic framework for diagnosing non-ideal behavior and refining CMOS process technology for short-channel devices.
GabFab: Fab Tracker and Process Assistant
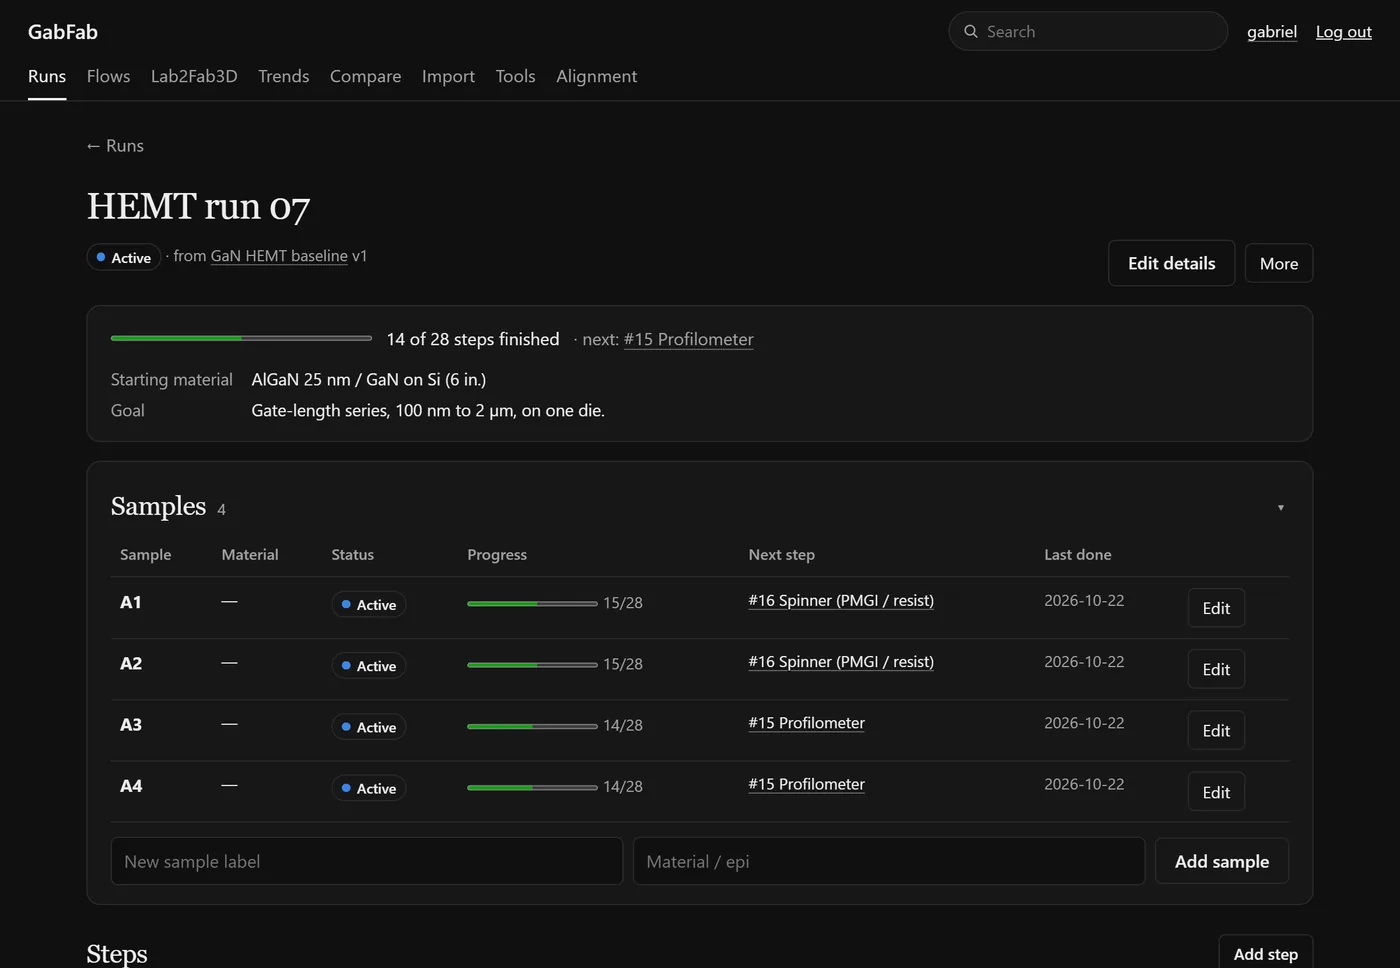
GabFab is the fab tracker I built for my GaN HEMT work at MIT.nano. It follows each sample through every step of a run, fits TLM contact resistance straight from the probe station’s files, and draws the device from the traveler, as cross sections and as the whole chip in 3D from the mask layout.
- Runs and samples: status, notes, measurements and redos for every sample at every step, used from a phone in the cleanroom
- TLM analysis: I–V sweeps in; Rc, Rsh, ρc and LT out for each site, with fit errors
- Process assistant: a Claude-based assistant with retrieval over the lab’s SOPs and a library of semiconductor process notes, citing its sources
- Lab2Fab3D: the chip in 3D at every step, built from the GDS masks and the traveler

Open GabFab (lab accounts)
Semiconductor Integration Simulator
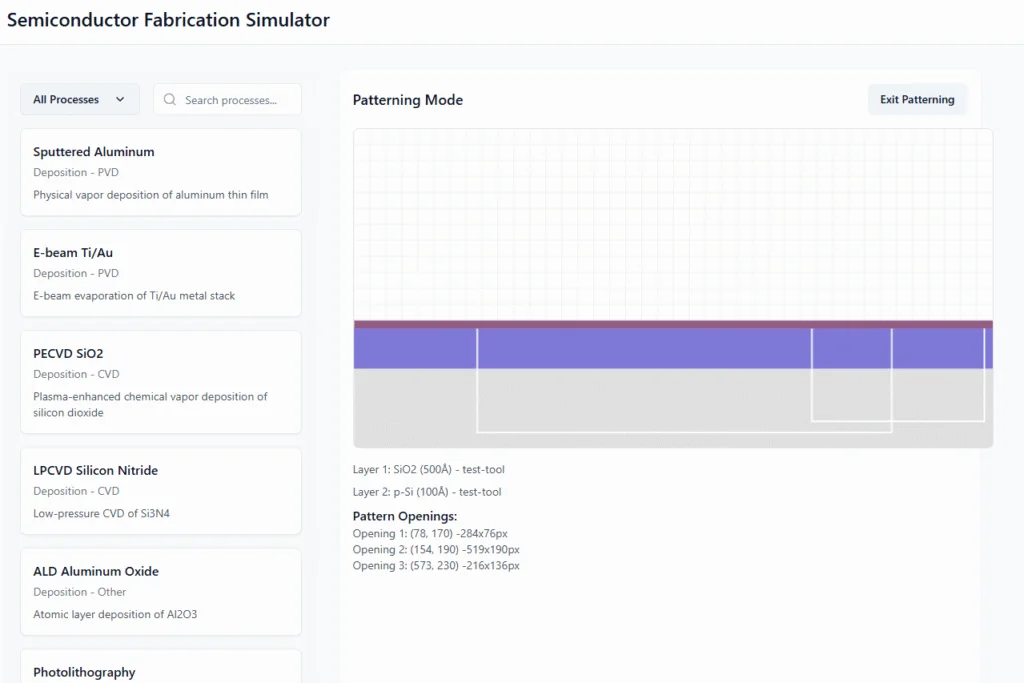
This application enables users to design and visualize semiconductor process flows in a clean, intuitive environment. Engineers can add deposition, etching, and patterning steps from a library of common processes, configure parameters such as material type and thickness, and instantly view a cross-sectional visualization of their device. The platform also supports mask integration; users can upload CAD layouts to define pattern geometries and observe how layers interact with lithography openings. By combining process sequencing with visual outputs, the tool bridges fabrication planning and device visualization, making it easier to iterate on integration schemes and document process flows.